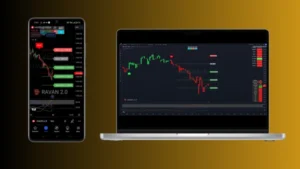
In the world of Intraday Trading, candlestick charts are not just a tool—they are your best friends. Imagine every flicker of the candle is like a heartbeat, giving you clues about market sentiment and price movement. My goal as your Intraday Stock Trading Trainer is simple: to help you fall in love with candlesticks. Today, let’s celebrate this special bond by learning how candlestick patterns speak the language of price action!
The Art of Observing Candlesticks
Candlesticks are the pulse of the market. Each candle tells a story of price action over a specific period—where the price started (open), moved (high and low), and closed. The trick to mastering trading is understanding the emotions behind each candle.
For example, the Bullish Engulfing pattern is like a big hug from the market. When this pattern forms, it suggests the buyers have taken control, and the market may move upward. Meanwhile, a Bearish Engulfing is a warning, like a breakup message, indicating sellers are gaining power, and prices might drop soon.
Price Action—The Heartbeat of Candlesticks
Price action on candlesticks reflects market psychology. Understanding patterns such as the Doji, where the open and close prices are nearly identical, signals indecision. It’s as if the market is unsure whether to love or leave. Recognizing these moments can help you plan your next move.
Make Candlesticks Your Best Friends
The more you observe candlesticks, the more you’ll start to see their patterns, much like understanding the rhythm of a song. Whether it’s the Hammer telling you that a reversal is coming or the Shooting Star signaling a downward trend, these patterns will become second nature to you. Practice makes perfect, and soon you’ll be reading candlesticks like love letters from the market.
So, let’s say it loud—Happy Valentine to Candlesticks! Let these patterns guide your trading, and you’ll form a lasting relationship with success.